Using Node Graphs for Subdomain Relationship Mapping
I built vibecoded a simple app that lets you visualize subdomain relationships using a dynamic, drag-and-drop node network chart (everything runs locally via 3D.js, so no data ever leaves your browser).
AFAIK, the latest version of OWASP amass doesn’t support generating charts anymore. *play sad_trumpet.mp3 🎺
This feature is already integrated in aquatone, but I wanted something more flexible and simpler (just the subs, no other stuff) where I could just paste the merged results from passive and active sub enumeration.
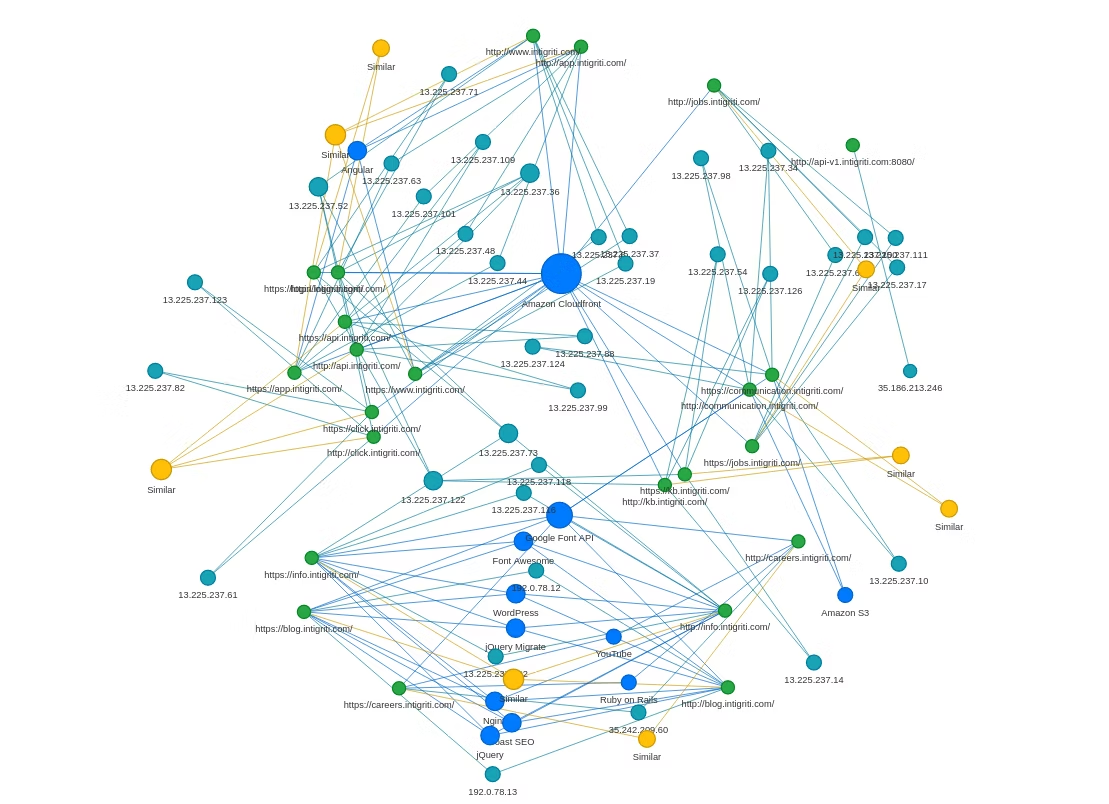
Honestly, it’s probably cooler than it is useful, but it could make for a neat addition to a report.
edit: I stumbled upon flowsint, which does something similar and much cooler.
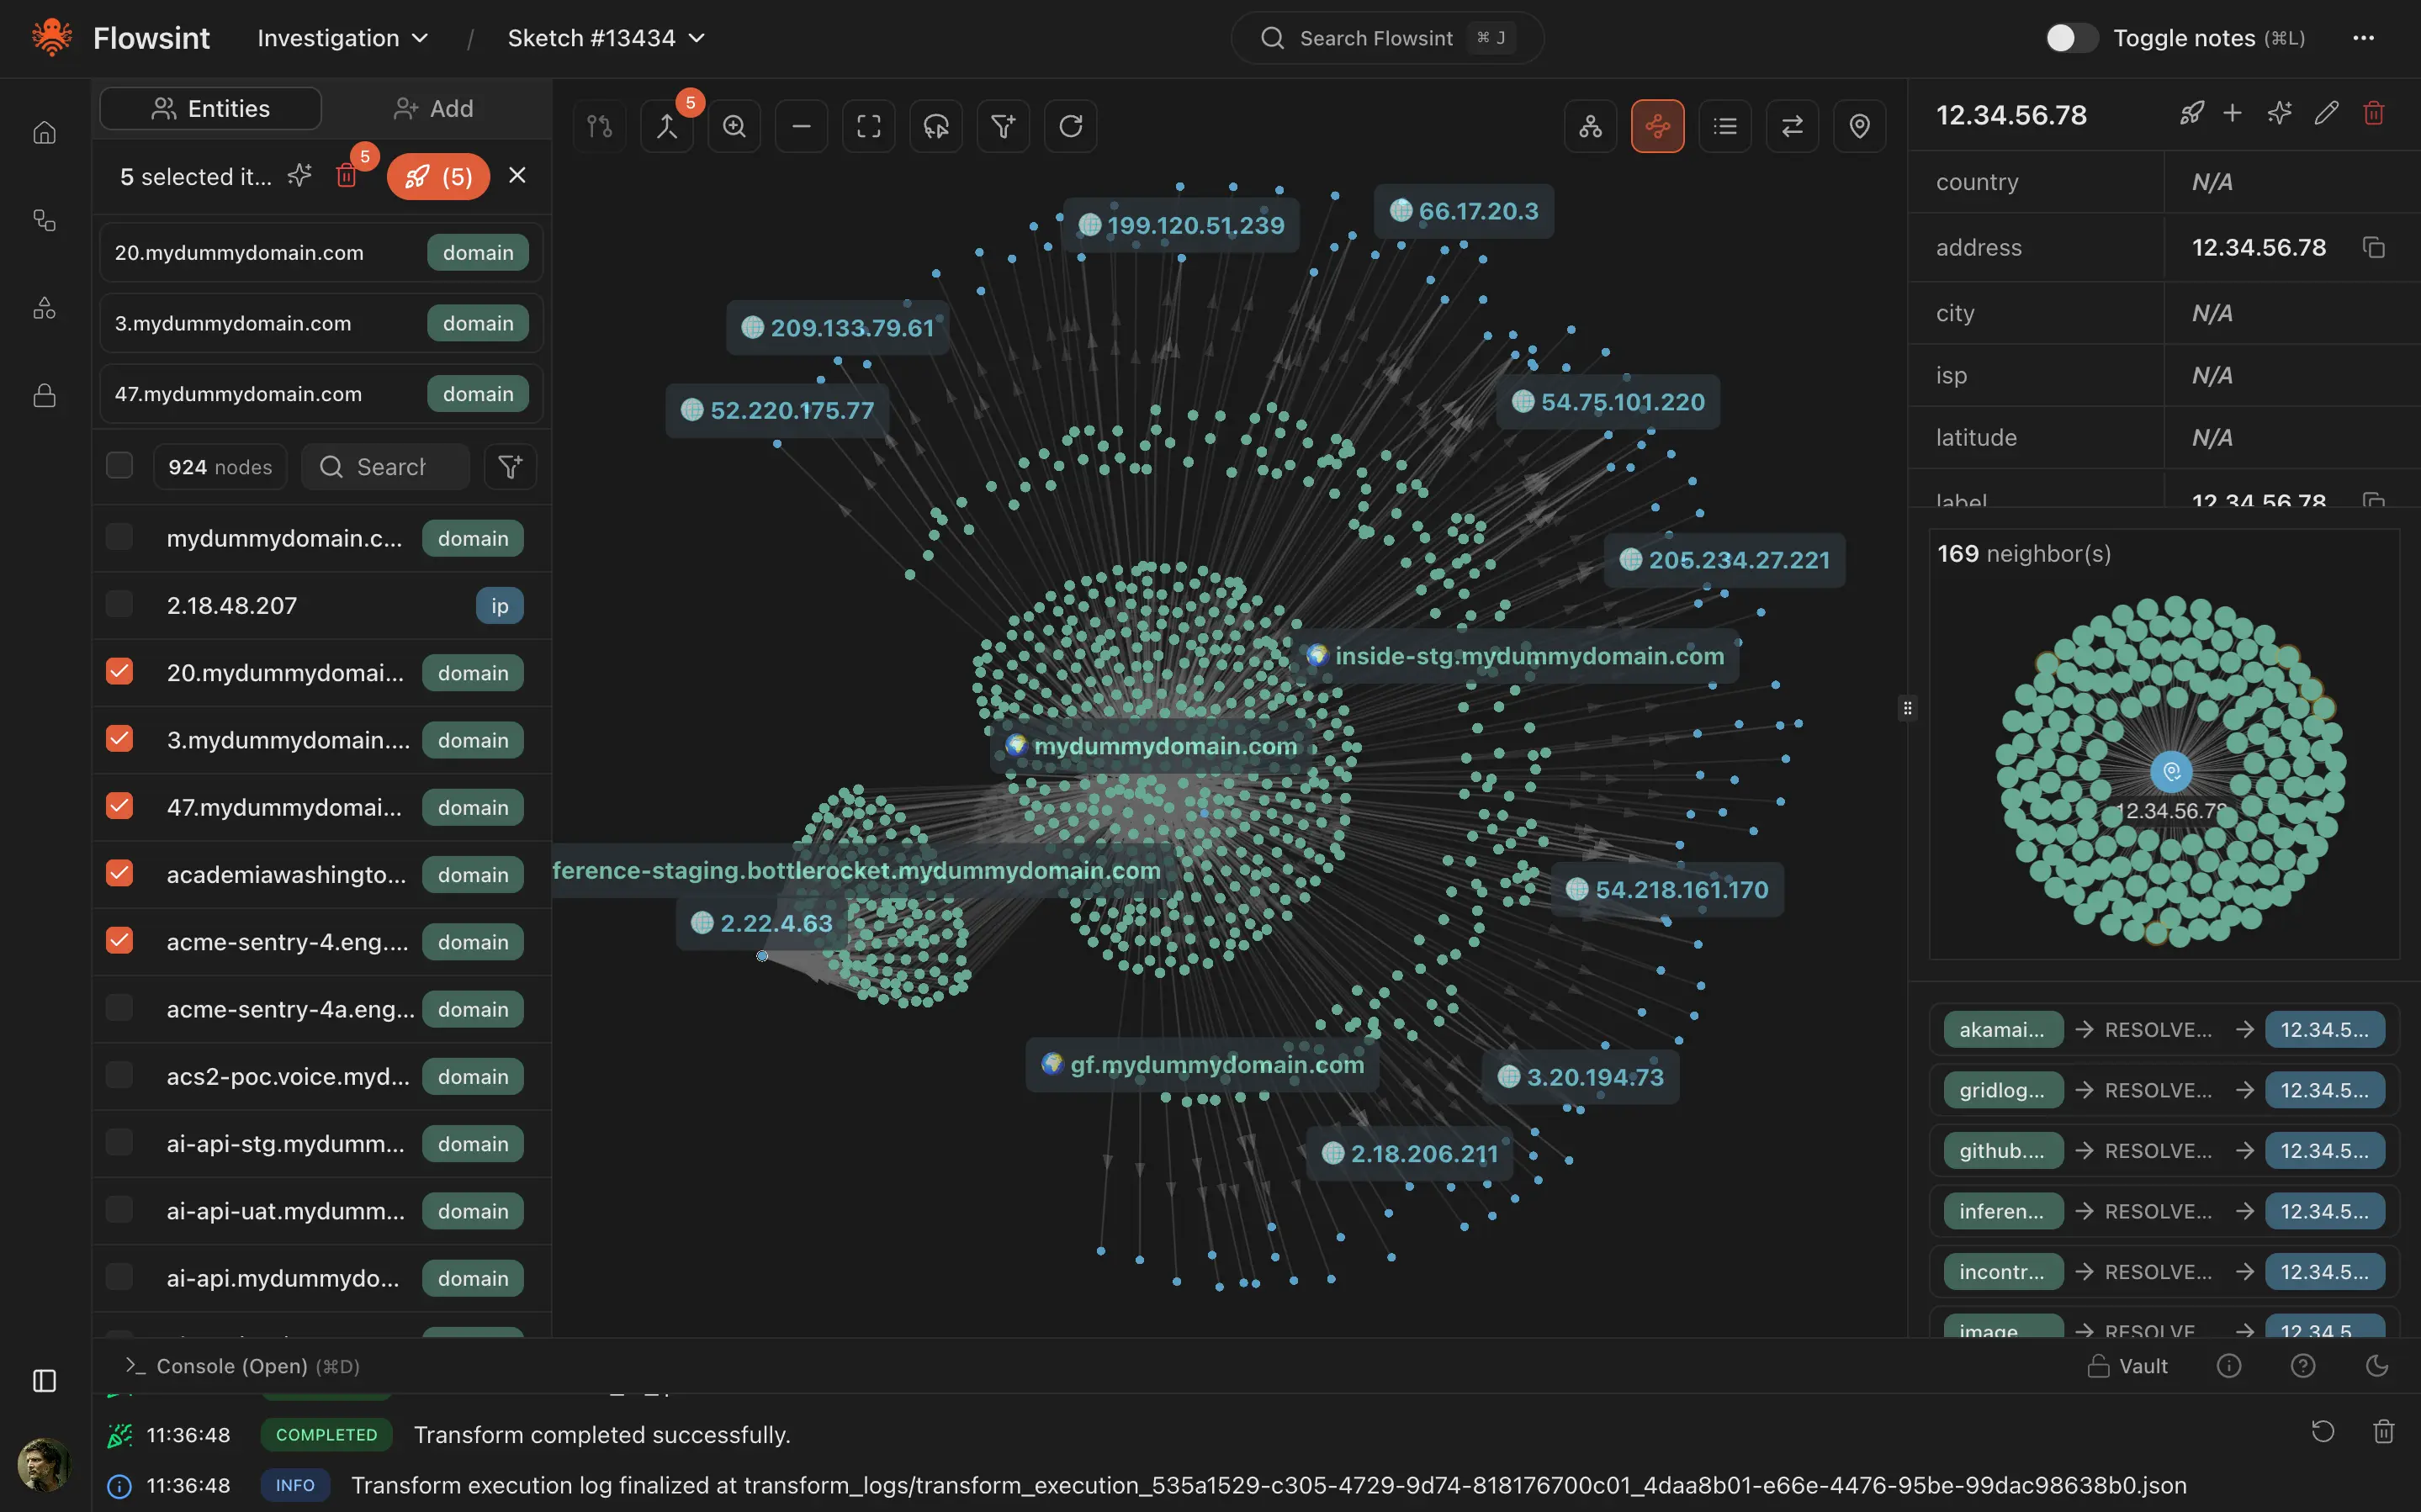
I still need to check what export options it has and, more importantly, whether it can be fed from different tools, which was the main reason for creating an ad-hoc tool.
Hey, I'd love to hear your thoughts! Just drop me an email.